Movie Theater
Part 1
Off by one errors and pesky zeroes.
points <-
  'input.txt' |>
  readLines() |>
  stringr::str_split(',') |>
  purrr::map(as.numeric)

points |>
  seq_along() |>
  utils::head(-1) |>
  purrr::map(\(i) {
    i:length(points) |>
      purrr::map_dbl(\(j) {
        if (i == j) return(0L)
        width <- abs(points[[i]][1] - points[[j]][1]) + 1
        height <- abs(points[[i]][2] - points[[j]][2]) + 1
        if (width == 0) width <- 1
        if (height == 0) height <- 1
        (width * height)
      })
  }) |>
  unlist() |>
  max()
[1] 4739623064Part 2
Very pleased with this one. I had this whole convoluted solution actually plotting out the green tiles but then was like “how do I check if something is in a polygon?” and realized I do know how to do that. geos is great for stuff like this. It’s super fast and easy to work with unlike sf. Unfortunately geos::geos_area() didn’t work because these are points on a grid and not a lat/long. There’s probably a CRS I could’ve used but I didn’t.
points <-
  'input.txt' |>
  readLines() |>
  stringr::str_split(',') |>
  purrr::map(as.numeric)

polygon_points <-
  points |>
  append(points[1]) |>
  do.call(rbind, args = _)

polygon <-
  geos::geos_make_polygon(x = polygon_points[,1], y = polygon_points[,2])

chosen_one <-
  expand.grid(
    'i' = seq_along(points),
    'j' = seq_along(points)
  ) |>
  dplyr::filter(.data$j > .data$i) |>
  dplyr::mutate(
    'rectangle' = purrr::map2_vec(.data$i, .data$j, \(i, j) {
      geos::geos_create_rectangle(
        points[[i]][1], points[[i]][2],
        points[[j]][1], points[[j]][2]
      )
    }),
    'covers' = geos::geos_contains(.env$polygon, .data$rectangle)
  ) |>
  dplyr::filter(.data$covers) |>
  dplyr::mutate(
    'area' = purrr::map2_dbl(.data$i, .data$j, \(i, j) {
      width <- abs(points[[i]][1] - points[[j]][1]) + 1
      height <- abs(points[[i]][2] - points[[j]][2]) + 1
      if (width == 0) width <- 1
      if (height == 0) height <- 1
      (width * height)
    })
  ) |>
  dplyr::filter(.data$area == max(.data$area))
plot(c(polygon, chosen_one$rectangle))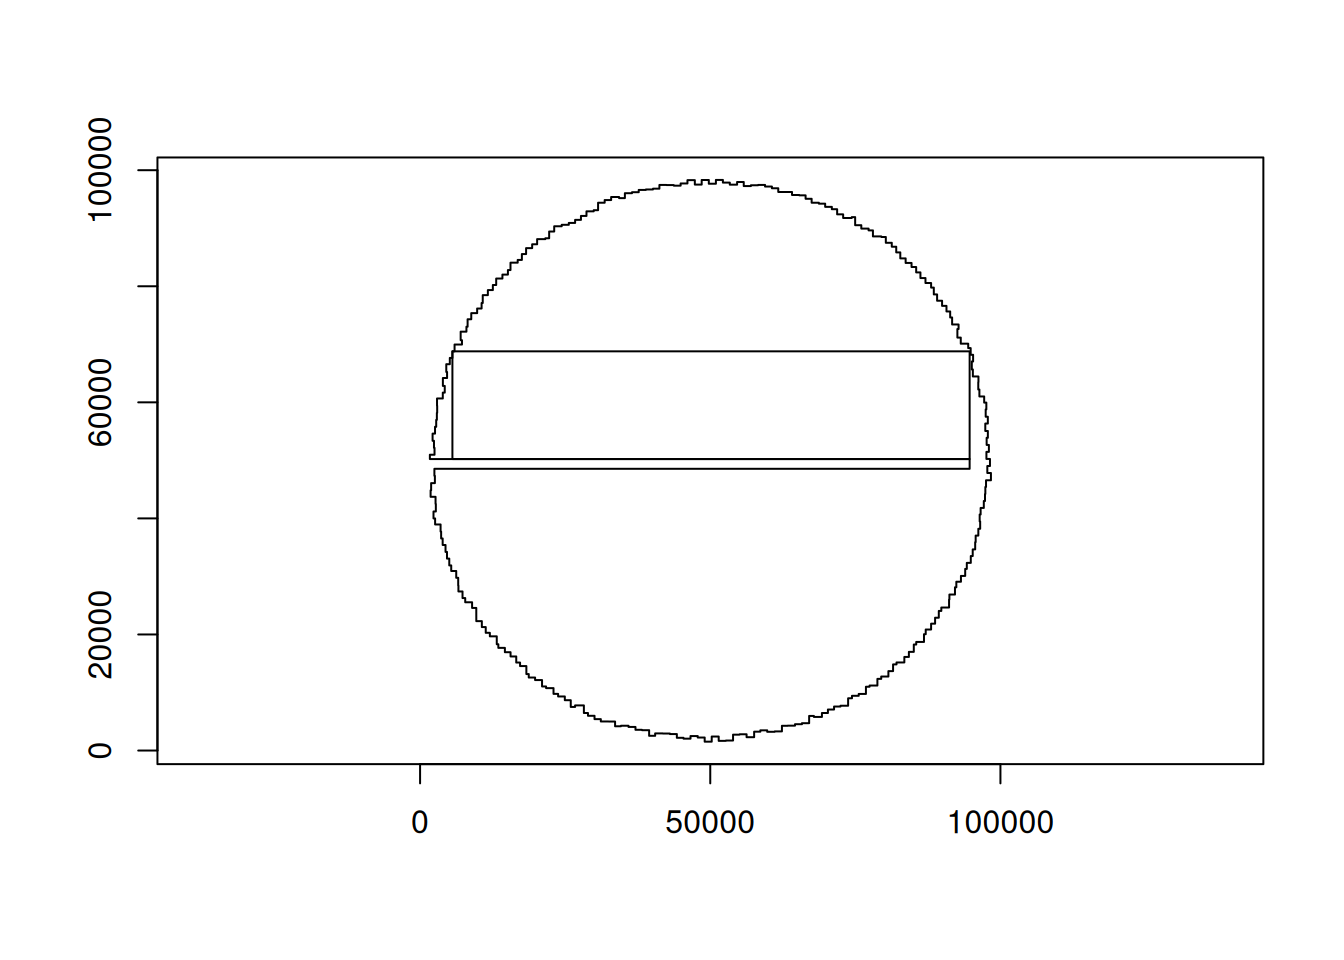
[1] 1654141440